


Drivers and decoupling effects of carbon emissions in Northwest China
-
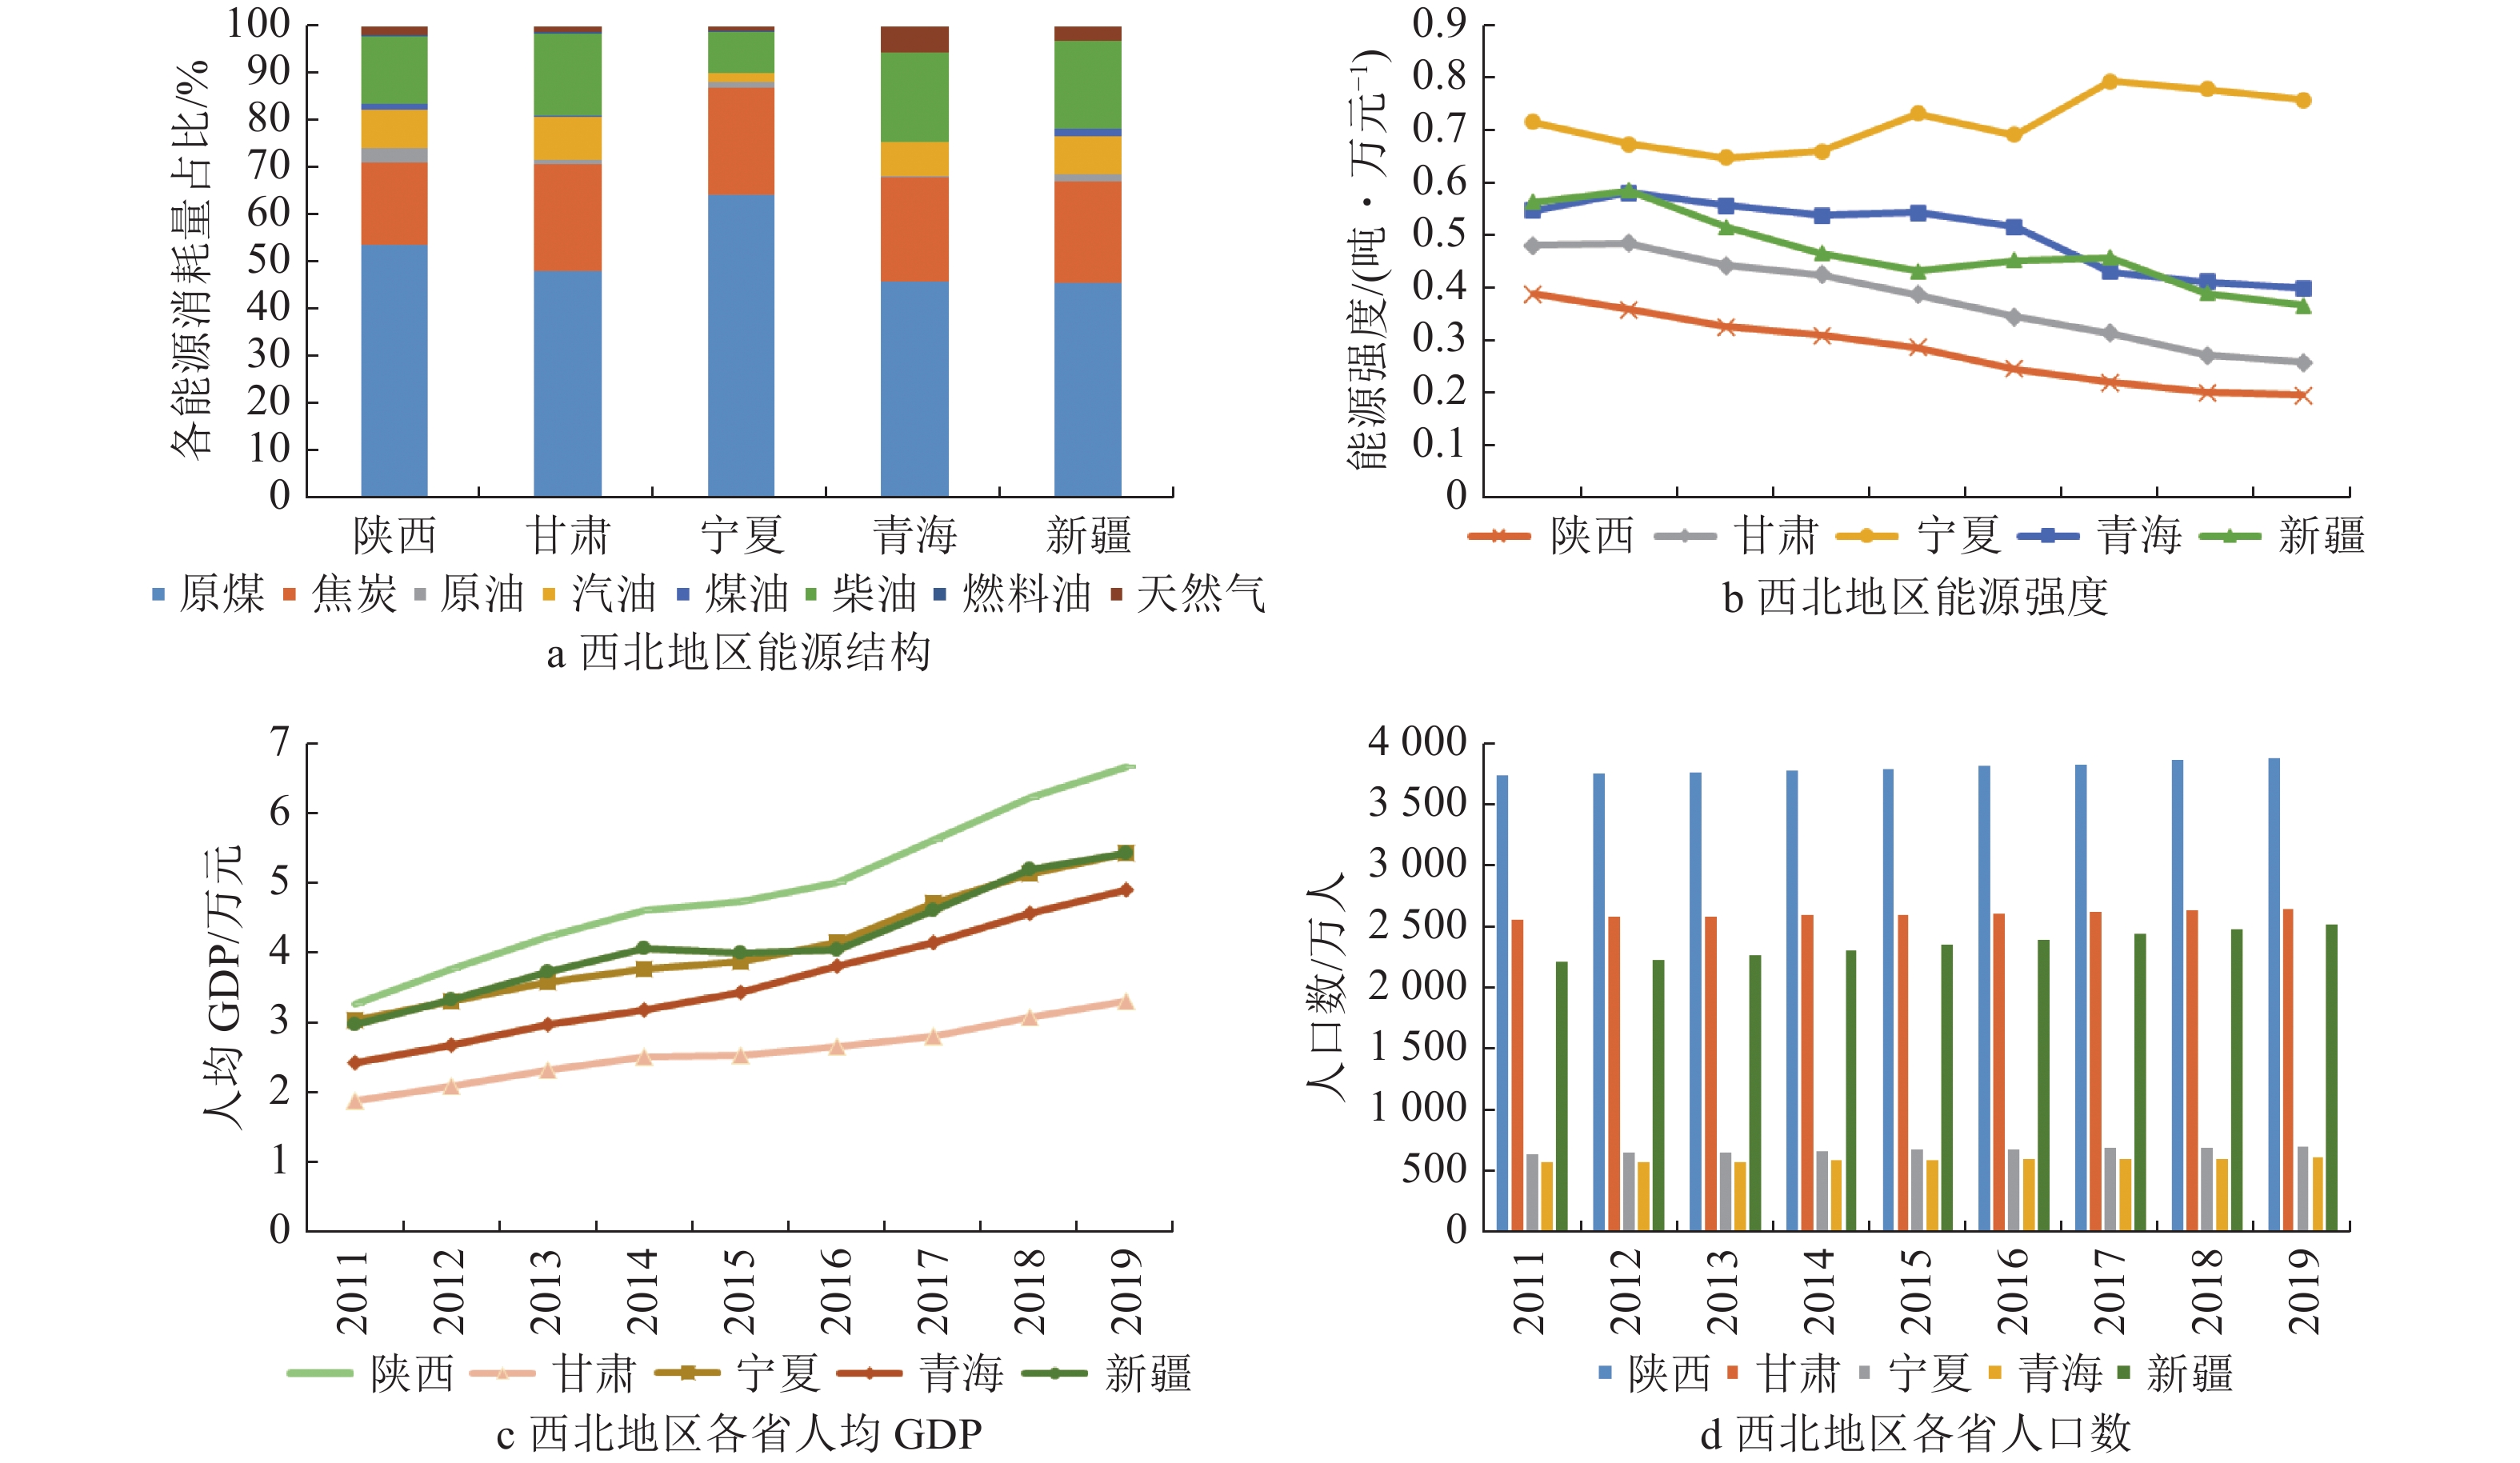
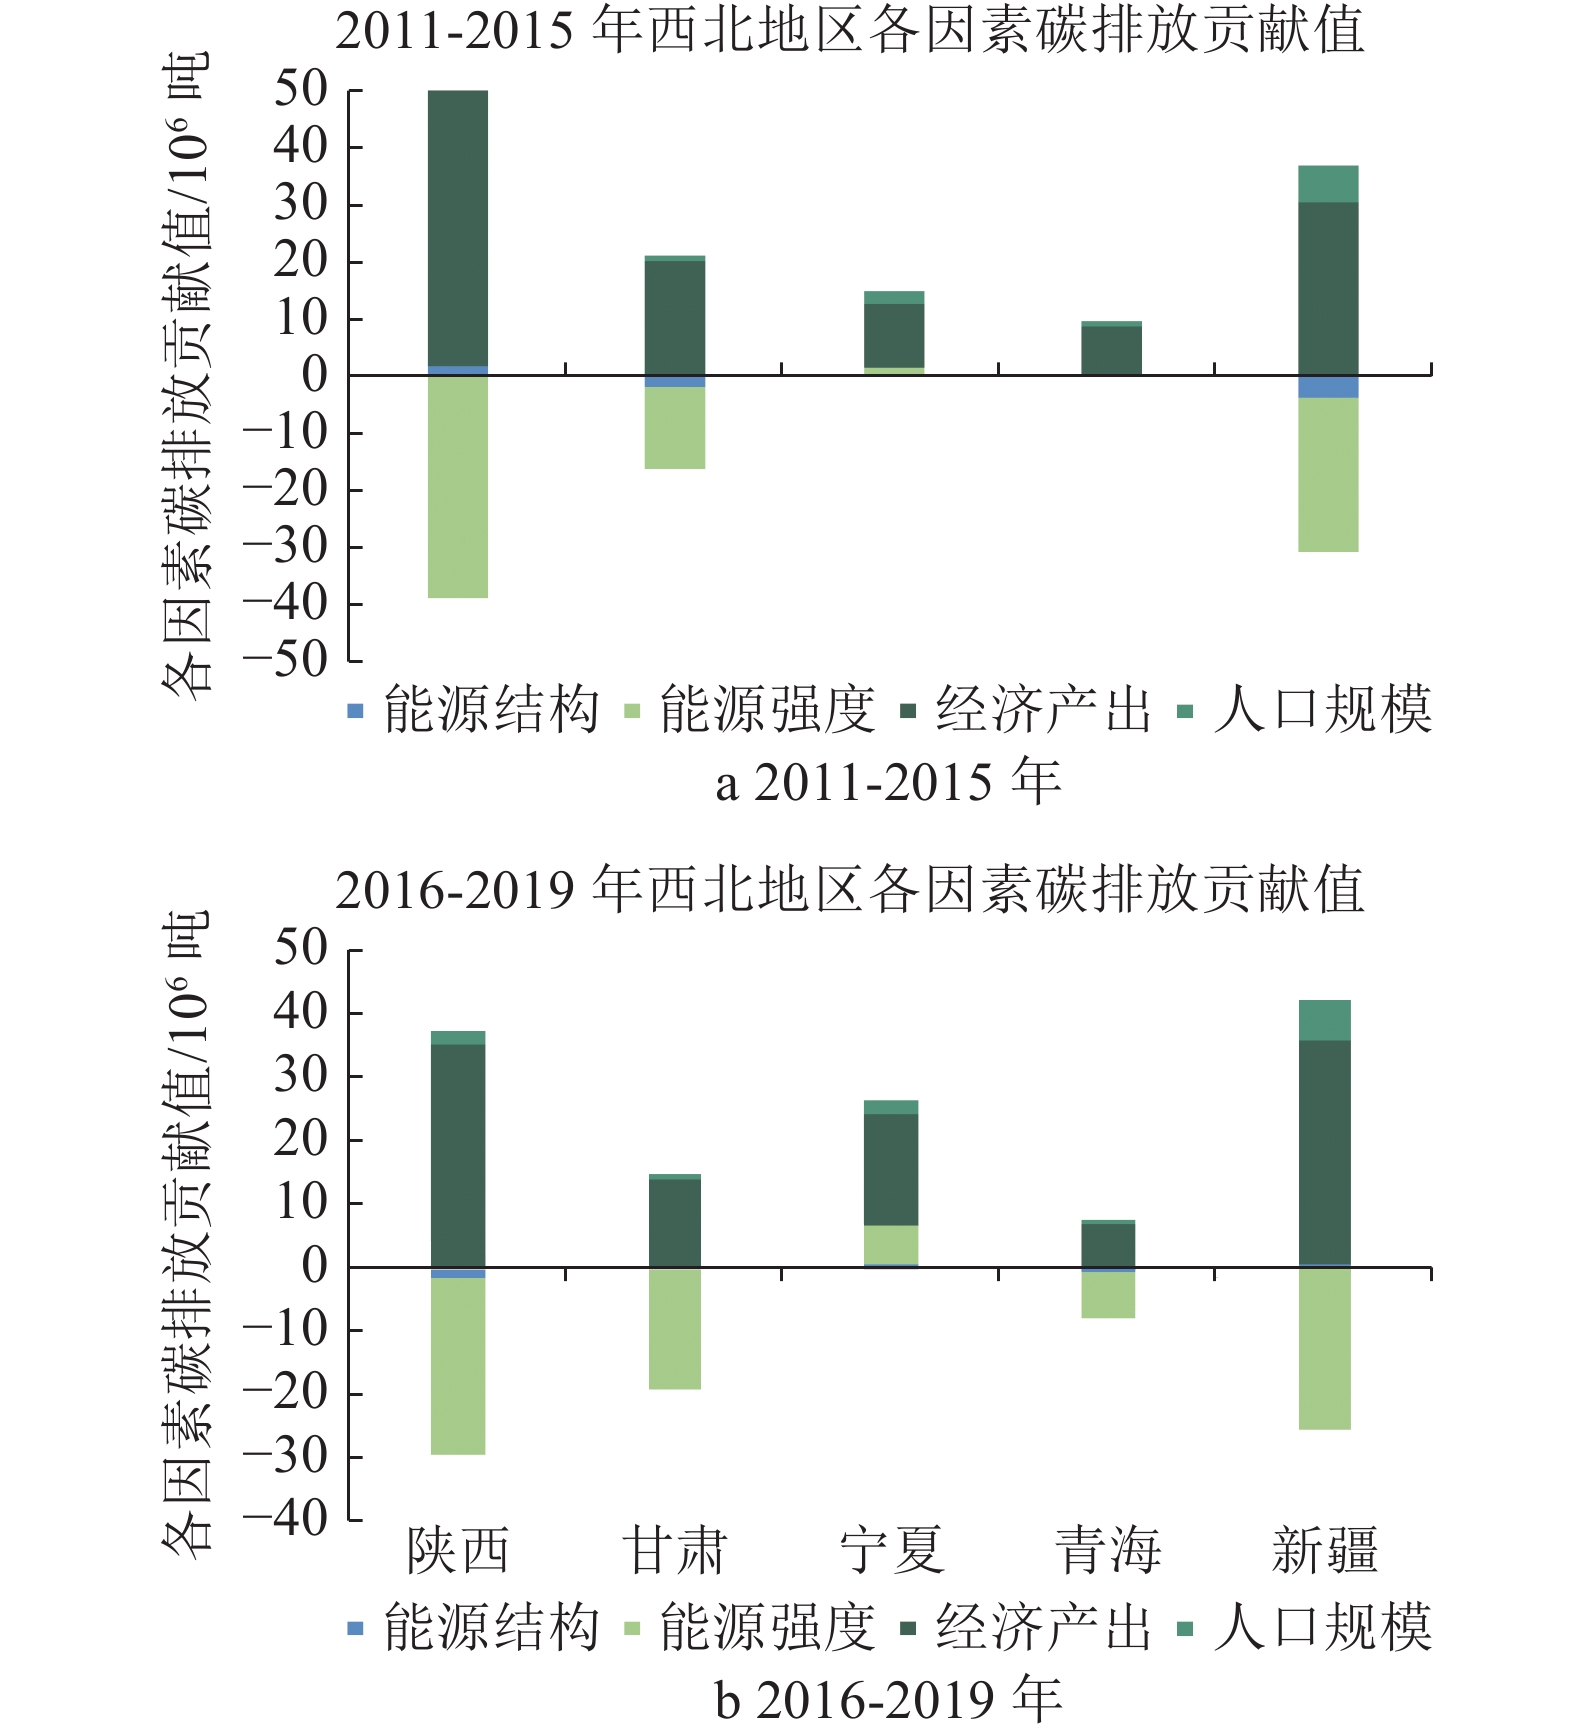
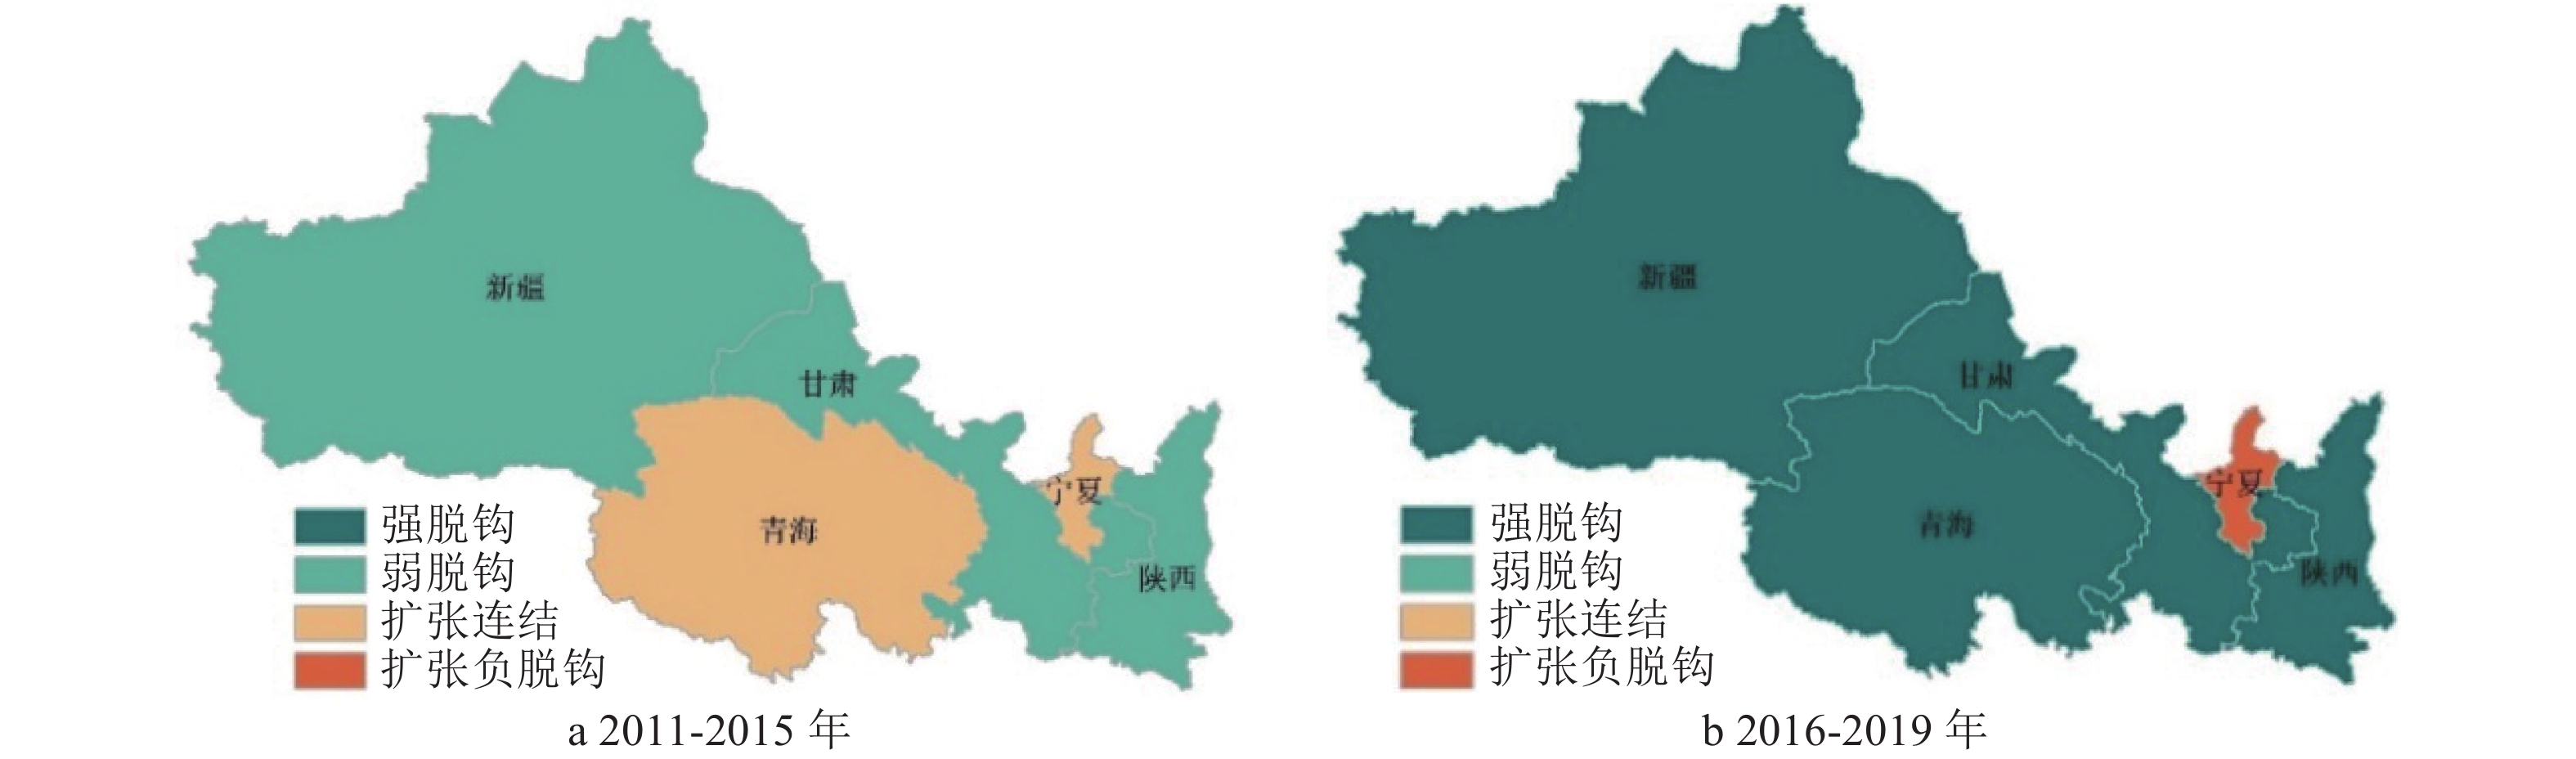
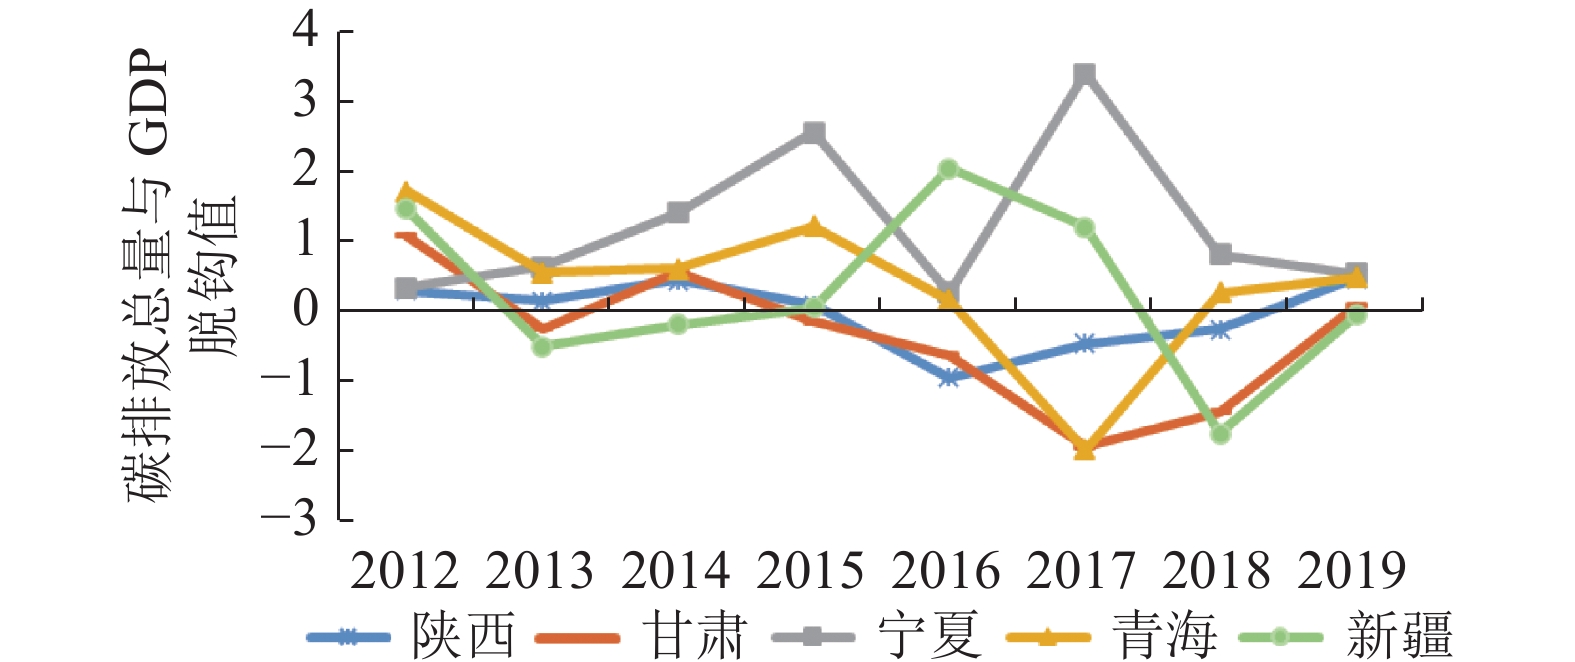
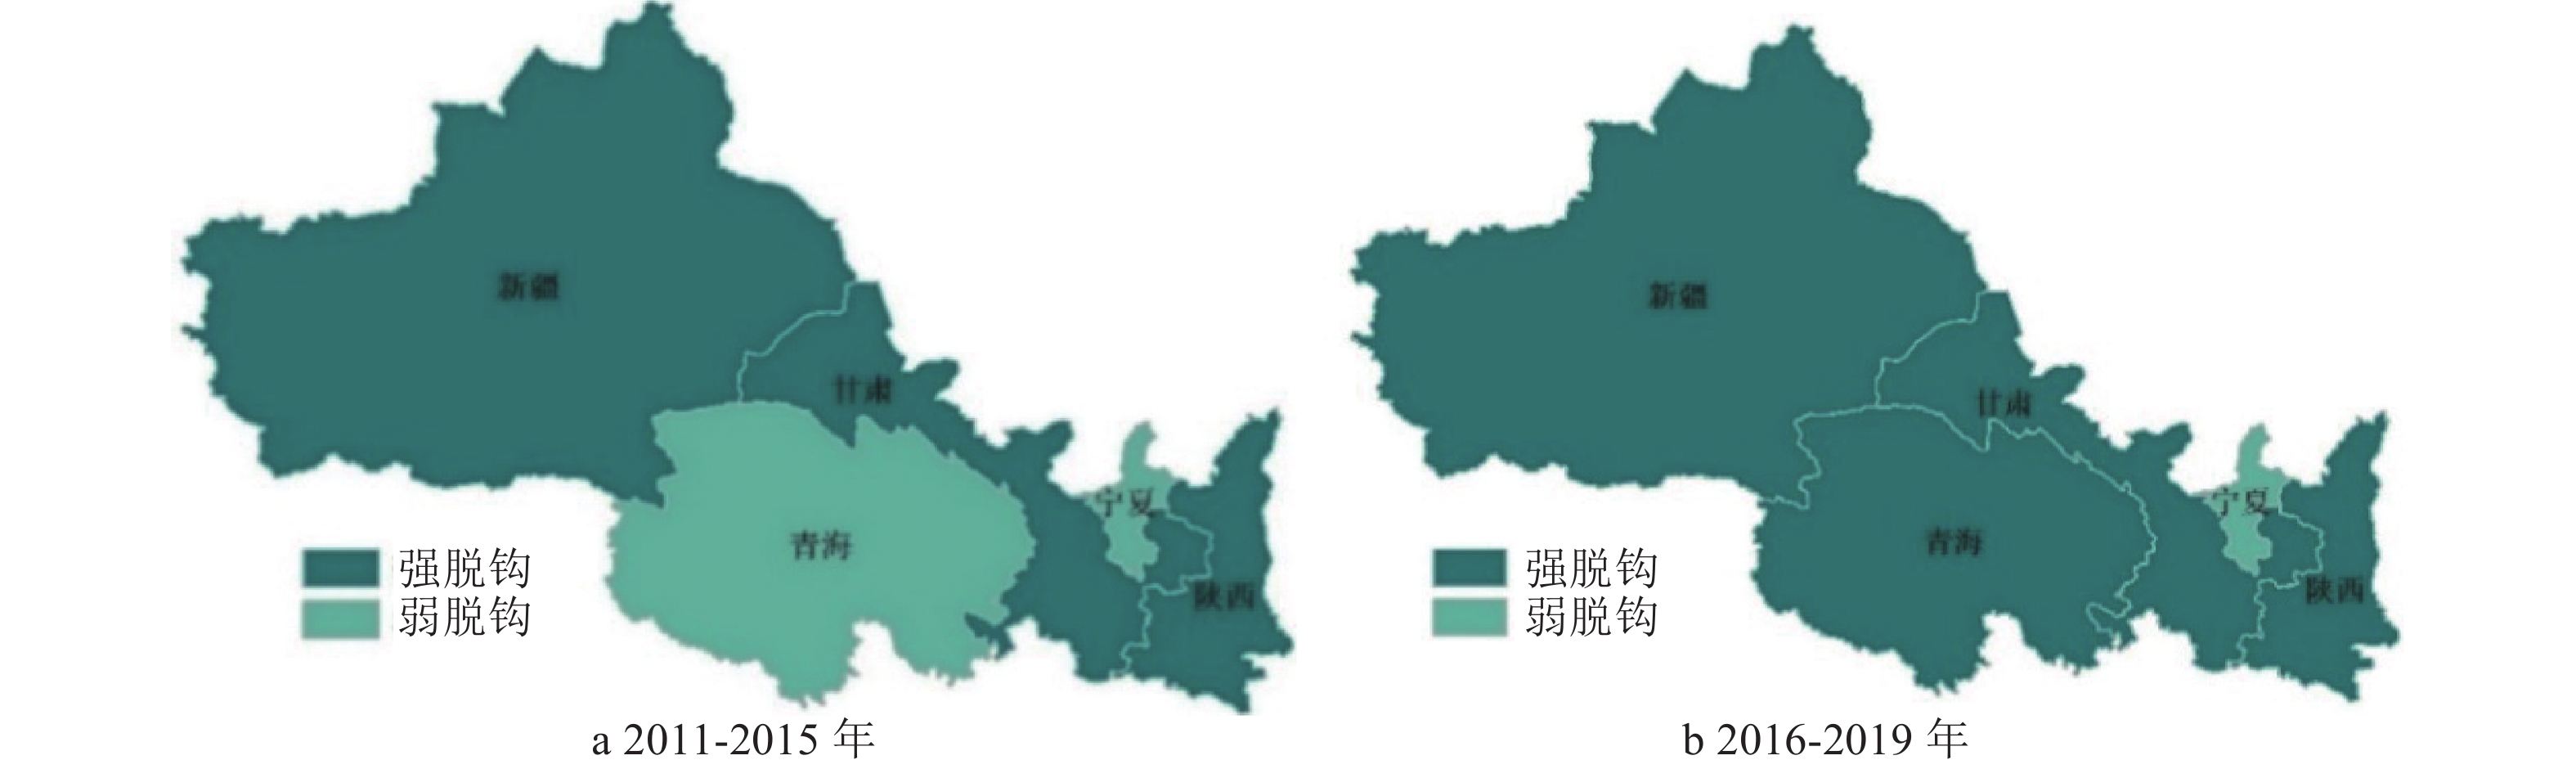
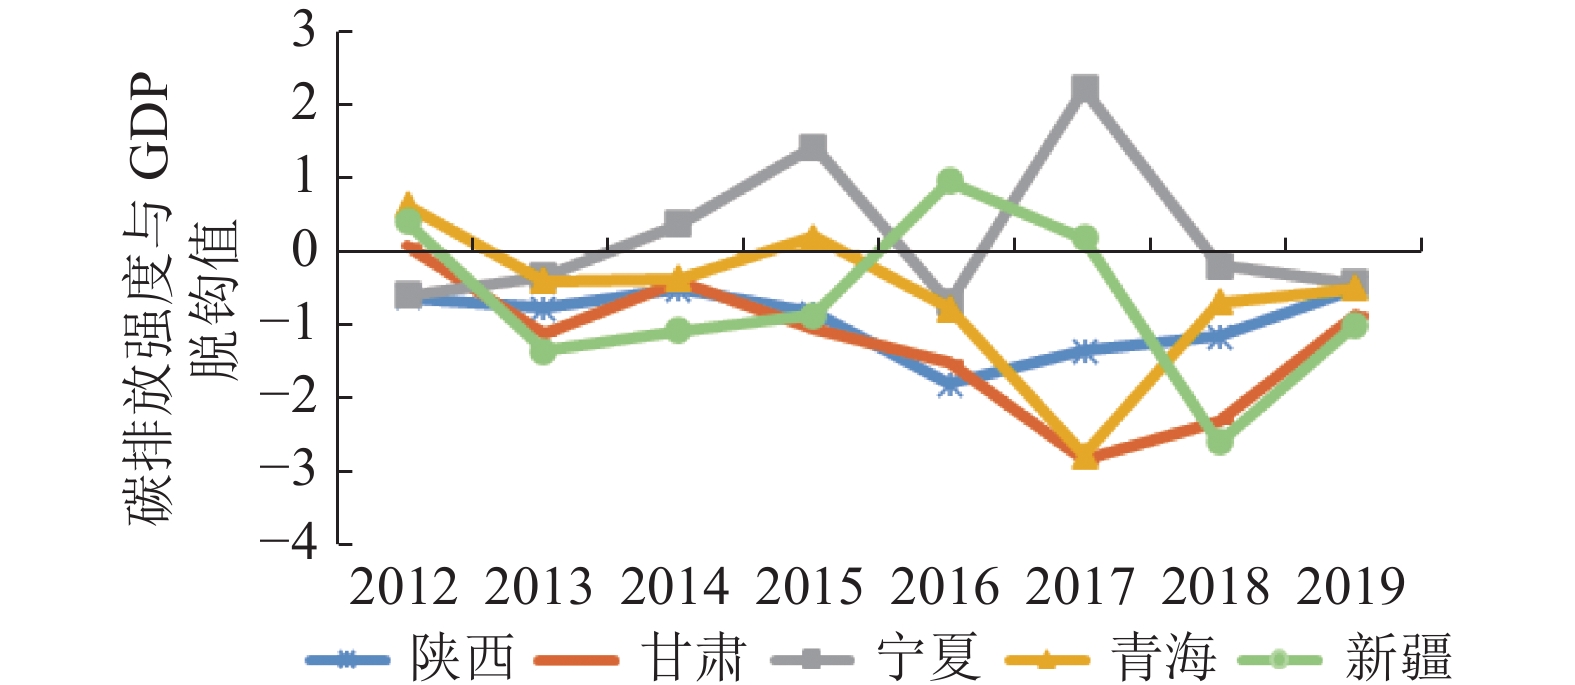
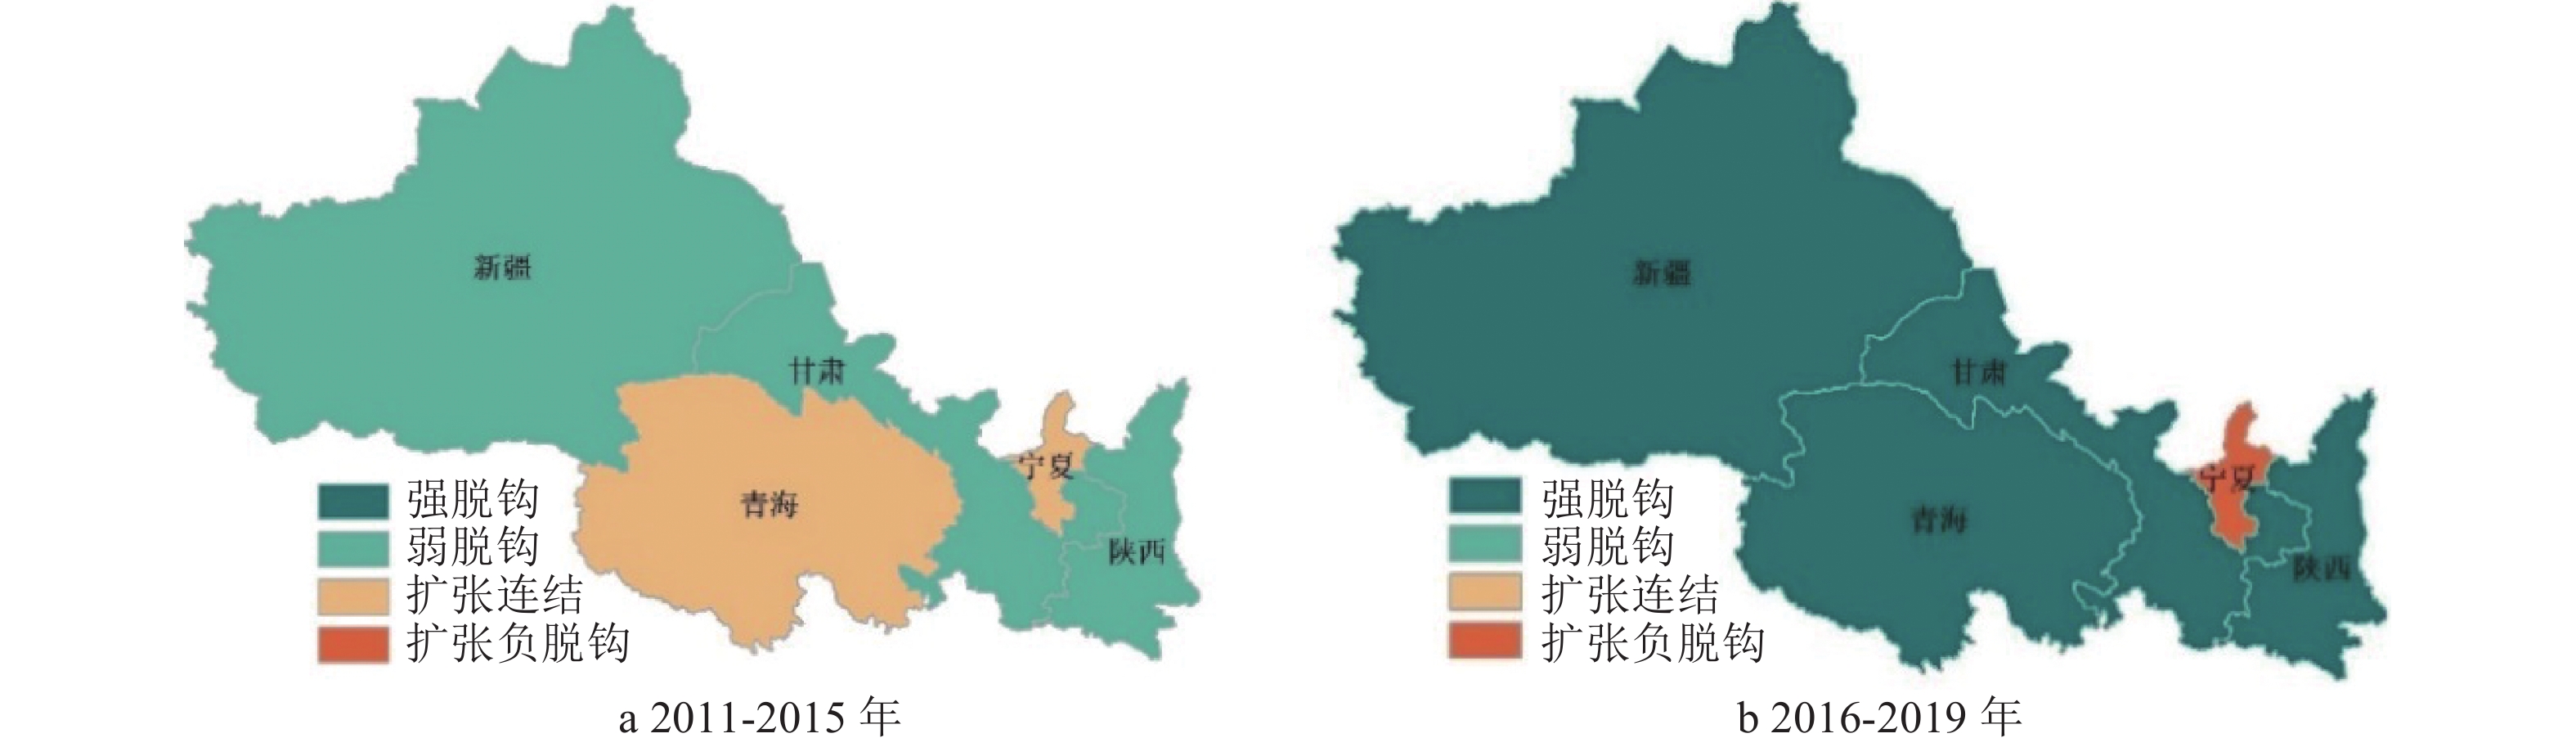
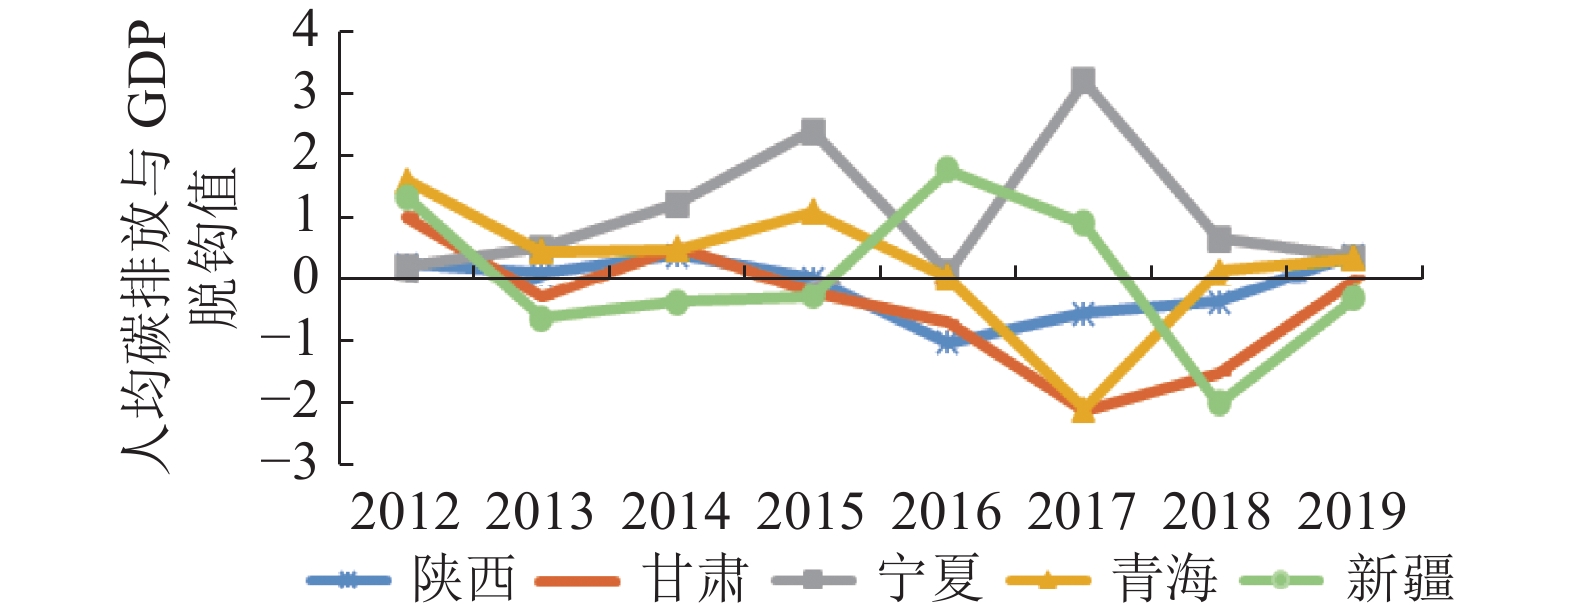
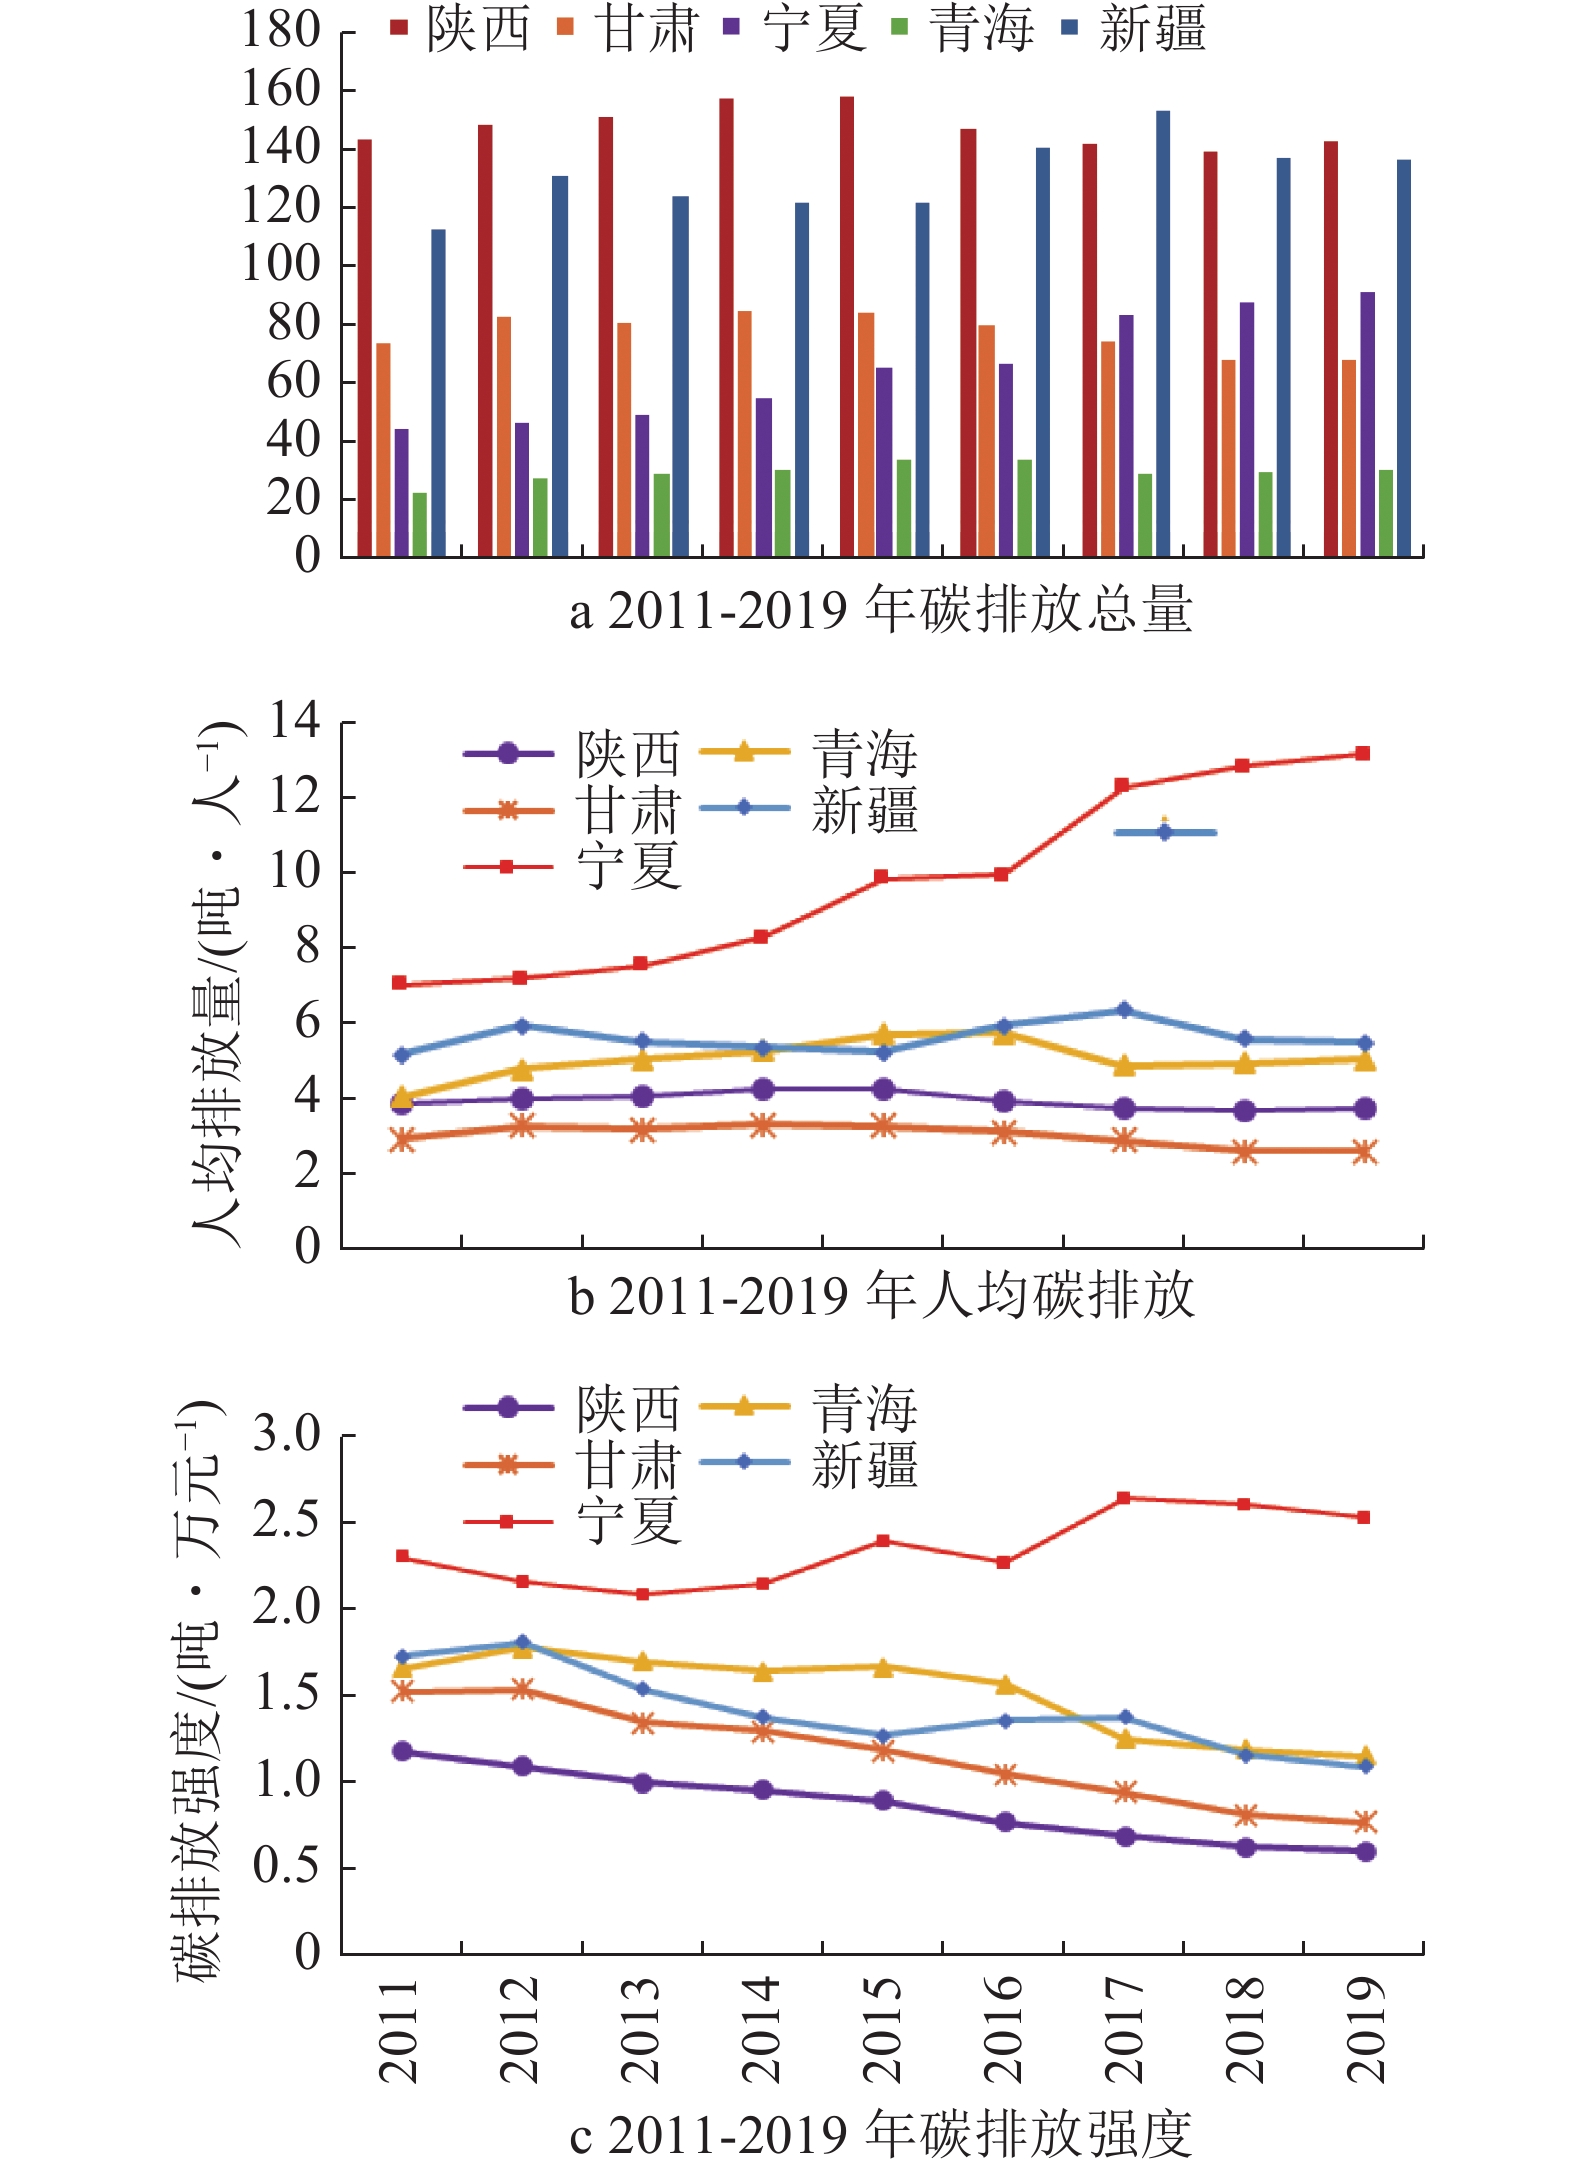
摘要:西北地区经济快速增长的需求与“双碳”目标的矛盾是其亟待解决的重要难题.文章选取西北地区2011—2019年的数据,采用碳排放系数法核算能源消费碳排放,并运用对数平均迪氏指数(LMDI)方法,研究了能源结构、能源强度、经济产出和人口规模对碳排放水平的影响;构建Tapio脱钩模型,对碳排放与经济发展的脱钩指数进行测度,并分析了碳排放与经济发展的脱钩关系.研究表明:(1)陕西省是西北地区碳排放量最大的省份,其次是新疆、甘肃、宁夏和青海.(2)经济产出和人口规模会促进碳排放,与经济产出相比人口规模对碳排放的影响较小;能源强度会促进碳减排;能源结构对碳排放的作用存在两面性.(3)碳排放总量、碳排放强度、人均碳排放与经济发展的脱钩关系均有向强脱钩转变的趋势;陕西、甘肃、新疆和青海的碳排放总量、碳排放强度、人均碳排放与经济发展实现了强脱钩.研究结果丰富了碳排放驱动因素与脱钩效应的相关研究,为西北地区协调区域经济发展和削减碳排放提供了针对性的政策建议.Abstract:The contradiction between the demand of rapid economic growth and the “double carbon” target in Northwest China is an important problem to be solved. The article selects the data of Northwest China from 2011 to 2019, adopts the carbon emission coefficient method to account for the carbon emissions of energy consumption, and uses the LMDI method to study the influence of energy structure, energy intensity, economic output and population size on the carbon emission level. . The study shows that (1) Shaanxi Province is the largest province in northwest China in terms of carbon emissions, followed by Xinjiang, Gansu, Ningxia and Qinghai. (2) Economic output and population size will promote carbon emissions, and the impact of population size on carbon emissions is smaller compared with economic output; energy intensity will promote carbon emission reduction; and the role of energy structure on carbon emissions has two sides. (3) The decoupling relationships of total carbon emission, carbon emission intensity, per capita carbon emission and economic development all tend to change to strong decoupling; Shaanxi, Gansu, Xinjiang and Qinghai achieve strong decoupling of total carbon emission, carbon emission intensity, per capita carbon emission and economic development. The findings enrich the research related to carbon emission drivers and decoupling effects, and provide targeted policy recommendations for coordinating regional economic development and reducing carbon emissions in Northwest China.
-
Key words:
- Northwest China/
- Carbon emissions/
- LMDI model/
- Driving factors/
- Decoupling effect
-
表 1八种化石能源碳排放计算参数
能源类型 原煤 焦炭 原油 汽油 煤油 柴油 燃料油 天然气 折标煤系数/$\left( {t\left( C \right) \cdot {t^{ - 1} } } \right)$① 0.7143 0.9714 1.4286 1.4714 1.4714 1.4571 1.4286 1.3300 碳排放系数/$\left( {t\left( C \right) \cdot {t^{ - 1} } } \right)$② 0.7559 0.855 0.5857 0.5538 0.5714 0.5921 0.6185 0.4483 备注:①来自《中国能源统计年鉴》;②来自IPCC指南.  下载:
导出CSV
下载:
导出CSV
表 2脱钩程度判别标准
脱钩状态 脱钩程度 $\Delta C$ $\Delta D$ 弹性$t$ 负脱钩 扩张负脱钩 $ > 0$ $ > 0$ $ > 1.2$ 强负脱钩 $ > 0$ $ < 0$ $ < 0$ 弱负脱钩 $ < 0$ $ < 0$ $0 < t < 0.8$ 脱钩 弱脱钩 $ > 0$ $ > 0$ $0 < t < 0.8$ 强脱钩 $ < 0$ $ > 0$ $ < 0$ 连结 衰退脱钩 $ < 0$ $ < 0$ $ > 1.2$ 扩张连结 $ > 0$ $ > 0$ $0.8 \leqslant t \leqslant 1.2$ 衰退连结 $ < 0$ $ < 0$ $0.8 \leqslant t \leqslant 1.2$ 数据来源[24] 下载:
导出CSV
表 3西北地区碳排放水平
年份 碳排放量/亿t 人均碳排放/人 碳排放强度/吨万元 2011 3.97 4.09 1.48 2012 4.36 4.45 1.45 2013 4.33 4.40 1.31 2014 4.48 4.52 1.23 2015 4.63 4.62 1.18 2016 4.68 4.64 1.11 2017 4.81 4.73 1.07 2018 4.61 4.48 0.95 2019 4.68 4.53 0.91 下载:
导出CSV
-
[1] UNDRR. Policy brief: Disaster risk reduction and climate change[R]. Geneva: UNDRR, 2021 [2] UNDRR. The human cost of disasters: an overview of the last 20 years (2000-2019)[R]. Geneva: UNDRR, 2020 [3] HANG Y,WANG Q W,ZHOU D Q,et al. Factors influencing the progress in decoupling economic growth from carbon dioxide emissions in China’s manufacturing industry[J]. Resources,Conservation and Recycling,2019,146:77doi:10.1016/j.resconrec.2019.03.034 [4] SU B,ANG B W. Structural decomposition analysis applied to energy and emissions:some methodological developments[J]. Energy Economics,2012,34(1):177doi:10.1016/j.eneco.2011.10.009 [5] XU X Y,ANG B W. Index decomposition analysis applied to CO2emission studies[J]. Ecological Economics,2013,93:313doi:10.1016/j.ecolecon.2013.06.007 [6] FAN F Y,LEI Y L. Factor analysis of energy-related carbon emissions:a case study of Beijing[J]. Journal of Cleaner Production,2017,163:S277doi:10.1016/j.jclepro.2015.07.094 [7] ANG B W,LIU N. Handling zero values in the logarithmic mean Divisia index decomposition approach[J]. Energy Policy,2007,35(1):238doi:10.1016/j.enpol.2005.11.001 [8] KARMELLOS M,KOSMADAKIS V,DIMAS P,et al. A decomposition and decoupling analysis of carbon dioxide emissions from electricity generation:evidence from the EU-27 and the UK[J]. Energy,2021,231:120861doi:10.1016/j.energy.2021.120861 [9] LIANG Y,NIU D X,ZHOU W W,et al. Decomposition analysis of carbon emissions from energy consumption in Beijing-Tianjin-Hebei,China:a weighted-combination model based on logarithmic mean divisia index and shapley value[J]. Sustainability,2018,10(7):2535doi:10.3390/su10072535 [10] GUAN D B,MENG J,REINER D M,et al. Structural decline in China’s CO2emissions through transitions in industry and energy systems[J]. Nature Geoscience,2018,11(8):551doi:10.1038/s41561-018-0161-1 [11] KYONGHWA,JEONG,. LMDI decomposition analysis of greenhouse gas emissions in the Korean manufacturing sector[J]. Energy Policy,2013,62:1245doi:10.1016/j.enpol.2013.06.077 [12] 顾阿伦,何崇恺,吕志强. 基于LMDI方法分析中国产业结构变动对碳排放的影响[J]. 资源科学,2016,38(10):1861 [13] XU S C,HE Z X,LONG R Y,et al. Comparative analysis of the regional contributions to carbon emissions in China[J]. Journal of Cleaner Production,2016,127:406doi:10.1016/j.jclepro.2016.03.149 [14] JIE,YANG,. Driving forces of China’s CO2emissions from energy consumption based on Kaya-LMDI methods[J]. Science of the Total Environment,2020,711:134569doi:10.1016/j.scitotenv.2019.134569 [15] SU K,WEI D,LIN W X. Influencing factors and spatial patterns of energy-related carbon emissions at the city-scale in Fujian province,Southeastern China[J]. Journal of Cleaner Production,2020,244:118840doi:10.1016/j.jclepro.2019.118840 [16] ZHU B,SHAN H Y. Impacts of industrial structures reconstructing on carbon emission and energy consumption:a case of Beijing[J]. Journal of Cleaner Production,2020,245:118916doi:10.1016/j.jclepro.2019.118916 [17] 刘贤赵,高长春,宋炎,等. 湖南市域化石能源消费碳排放时空格局及驱动因素[J]. 生态学报,2017,37(7):2476 [18] WANG C J,WANG F,ZHANG X L,et al. Examining the driving factors of energy related carbon emissions using the extended STIRPAT model based on IPAT identity in Xinjiang[J]. Renewable and Sustainable Energy Reviews,2017,67:51doi:10.1016/j.rser.2016.09.006 [19] 赖文亭,王远,黄琳琳,等. 福建省行业碳排放驱动因素分解及其与经济增长脱钩关系[J]. 应用生态学报,2020,31(10):3529doi:10.13287/j.1001-9332.202010.016 [20] 李俊杰,刘湘. 宁夏碳排放影响因素与碳达峰预测[J]. 中南民族大学学报(人文社会科学版),2022,42(7):116doi:10.19898/j.cnki.42-1704/C.2022.0714 [21] SALAHUDDIN M,ALAM K,OZTURK I,et al. The effects of electricity consumption,economic growth,financial development and foreign direct investment on CO2emissions in Kuwait[J]. Renewable and Sustainable Energy Reviews,2018,81:2002doi:10.1016/j.rser.2017.06.009 [22] HAN F,XIE R,LU Y,et al. The effects of urban agglomeration economies on carbon emissions:evidence from Chinese cities[J]. Journal of Cleaner Production,2018,172:1096doi:10.1016/j.jclepro.2017.09.273 [23] SHARMA S S. Determinants of carbon dioxide emissions:Empirical evidence from 69 countries[J]. Applied Energy,2011,88(1):376doi:10.1016/j.apenergy.2010.07.022 [24] 习近平. 在二十国集团领导人利雅得峰会“守护地球”主题边会上的致辞: (2020年11月22日, 北京)[N]. 人民日报, 2020-11-23(2) [25] OECD. Indicators to Measure Decoupling of Environmental Pressure from Economic Growth[R]. Paris: OECD, 2002 [26] TAPIO P. Towards a theory of decoupling:degrees of decoupling in the EU and the case of road traffic in Finland between 1970 and 2001[J]. Transport Policy,2005,12(2):137doi:10.1016/j.tranpol.2005.01.001 [27] ZHOU X,ZHANG M,ZHOU M H,et al. A comparative study on decoupling relationship and influence factors between China's regional economic development and industrial energy–related carbon emissions[J]. Journal of Cleaner Production,2017,142:783doi:10.1016/j.jclepro.2016.09.115 [28] SHUAI C Y,CHEN X,WU Y,et al. A three-step strategy for decoupling economic growth from carbon emission:empirical evidences from 133 countries[J]. Science of the Total Environment,2019,646:524doi:10.1016/j.scitotenv.2018.07.045 [29] WU Y,TAM V W Y,SHUAI C,et al. Decoupling China's economic growth from carbon emissions:Empirical studies from 30 Chinese provinces (2001-2015)[J]. Science of the Total Environment,2019,656:576doi:10.1016/j.scitotenv.2018.11.384 [30] XU W H,XIE Y L,XIA D H,et al. A multi-sectoral decomposition and decoupling analysis of carbon emissions in Guangdong Province,China[J]. Journal of Environmental Management,2021,298:113485doi:10.1016/j.jenvman.2021.113485 [31] 顾张锋,徐丽华,马淇蔚,等. 浙江省都市区碳排放时空演变及其影响因素[J]. 自然资源学报,2022,37(6):1524 [32] 杨宇,刘毅. 基于DEA-ESDA的中国省际能源效率及其时空分异研究[J]. 自然资源学报,2014,29(11):1815doi:10.11849/zrzyxb.2014.11.001 [33] 国家统计局. 中国能源统计年鉴[M]. 北京: 中国统计出版社, 2011-2019 [34] 国家统计局. 中国统计年鉴[M]. 北京: 中国统计出版社, 2011-2019 [35] IPCC. IPCC Guidelines for National Greenhouse Gas Inventories[R]. United Kingdom Meteorological Office, Bracknell, England, 2006 [36] KAYA Y. Impact of carbon dioxide emission control on GNP growth: interpretation of proposed scenarios[R]. Paris: IPCC Energy and Industry Subgroup, 1989 [37] ANG B W. Decomposition analysis for policymaking in energy:[J]. Energy Policy,2004,32(9):1131doi:10.1016/S0301-4215(03)00076-4 [38] SHUAI C Y,CHEN X,WU Y,et al. Identifying the key impact factors of carbon emission in China:results from a largely expanded pool of potential impact factors[J]. Journal of Cleaner Production,2018,175:612doi:10.1016/j.jclepro.2017.12.097 [39] WANG Y N,ZHAO T. Impacts of energy-related CO2emissions:evidence from under developed,developing and highly developed regions in China[J]. Ecological Indicators,2015,50:186doi:10.1016/j.ecolind.2014.11.010 [40] XU S C,HE Z X,LONG R Y. Factors that influence carbon emissions due to energy consumption in China:decomposition analysis using LMDI[J]. Applied Energy,2014,127:182doi:10.1016/j.apenergy.2014.03.093 [41] ZHOU Y,LIU Y S. Does population have a larger impact on carbon dioxide emissions than income? Evidence from a cross-regional panel analysis in China[J]. Applied Energy,2016,180:800doi:10.1016/j.apenergy.2016.08.035 [42] CHEN C,ZHAO T,YUAN R,et al. A spatial-temporal decomposition analysis of China's carbon intensity from the economic perspective[J]. Journal of Cleaner Production,2019,215:557doi:10.1016/j.jclepro.2019.01.073 -

 下载:
下载:

 点击查看大图
图(9)/
表(3)
计量
- 文章访问数:27
- HTML全文浏览量:3
- PDF下载量:5
- 被引次数:0
