


Urban carbon footprint accounting and implications for carbon neutrality from a life cycle perspective: a case study of Shenzhen
-
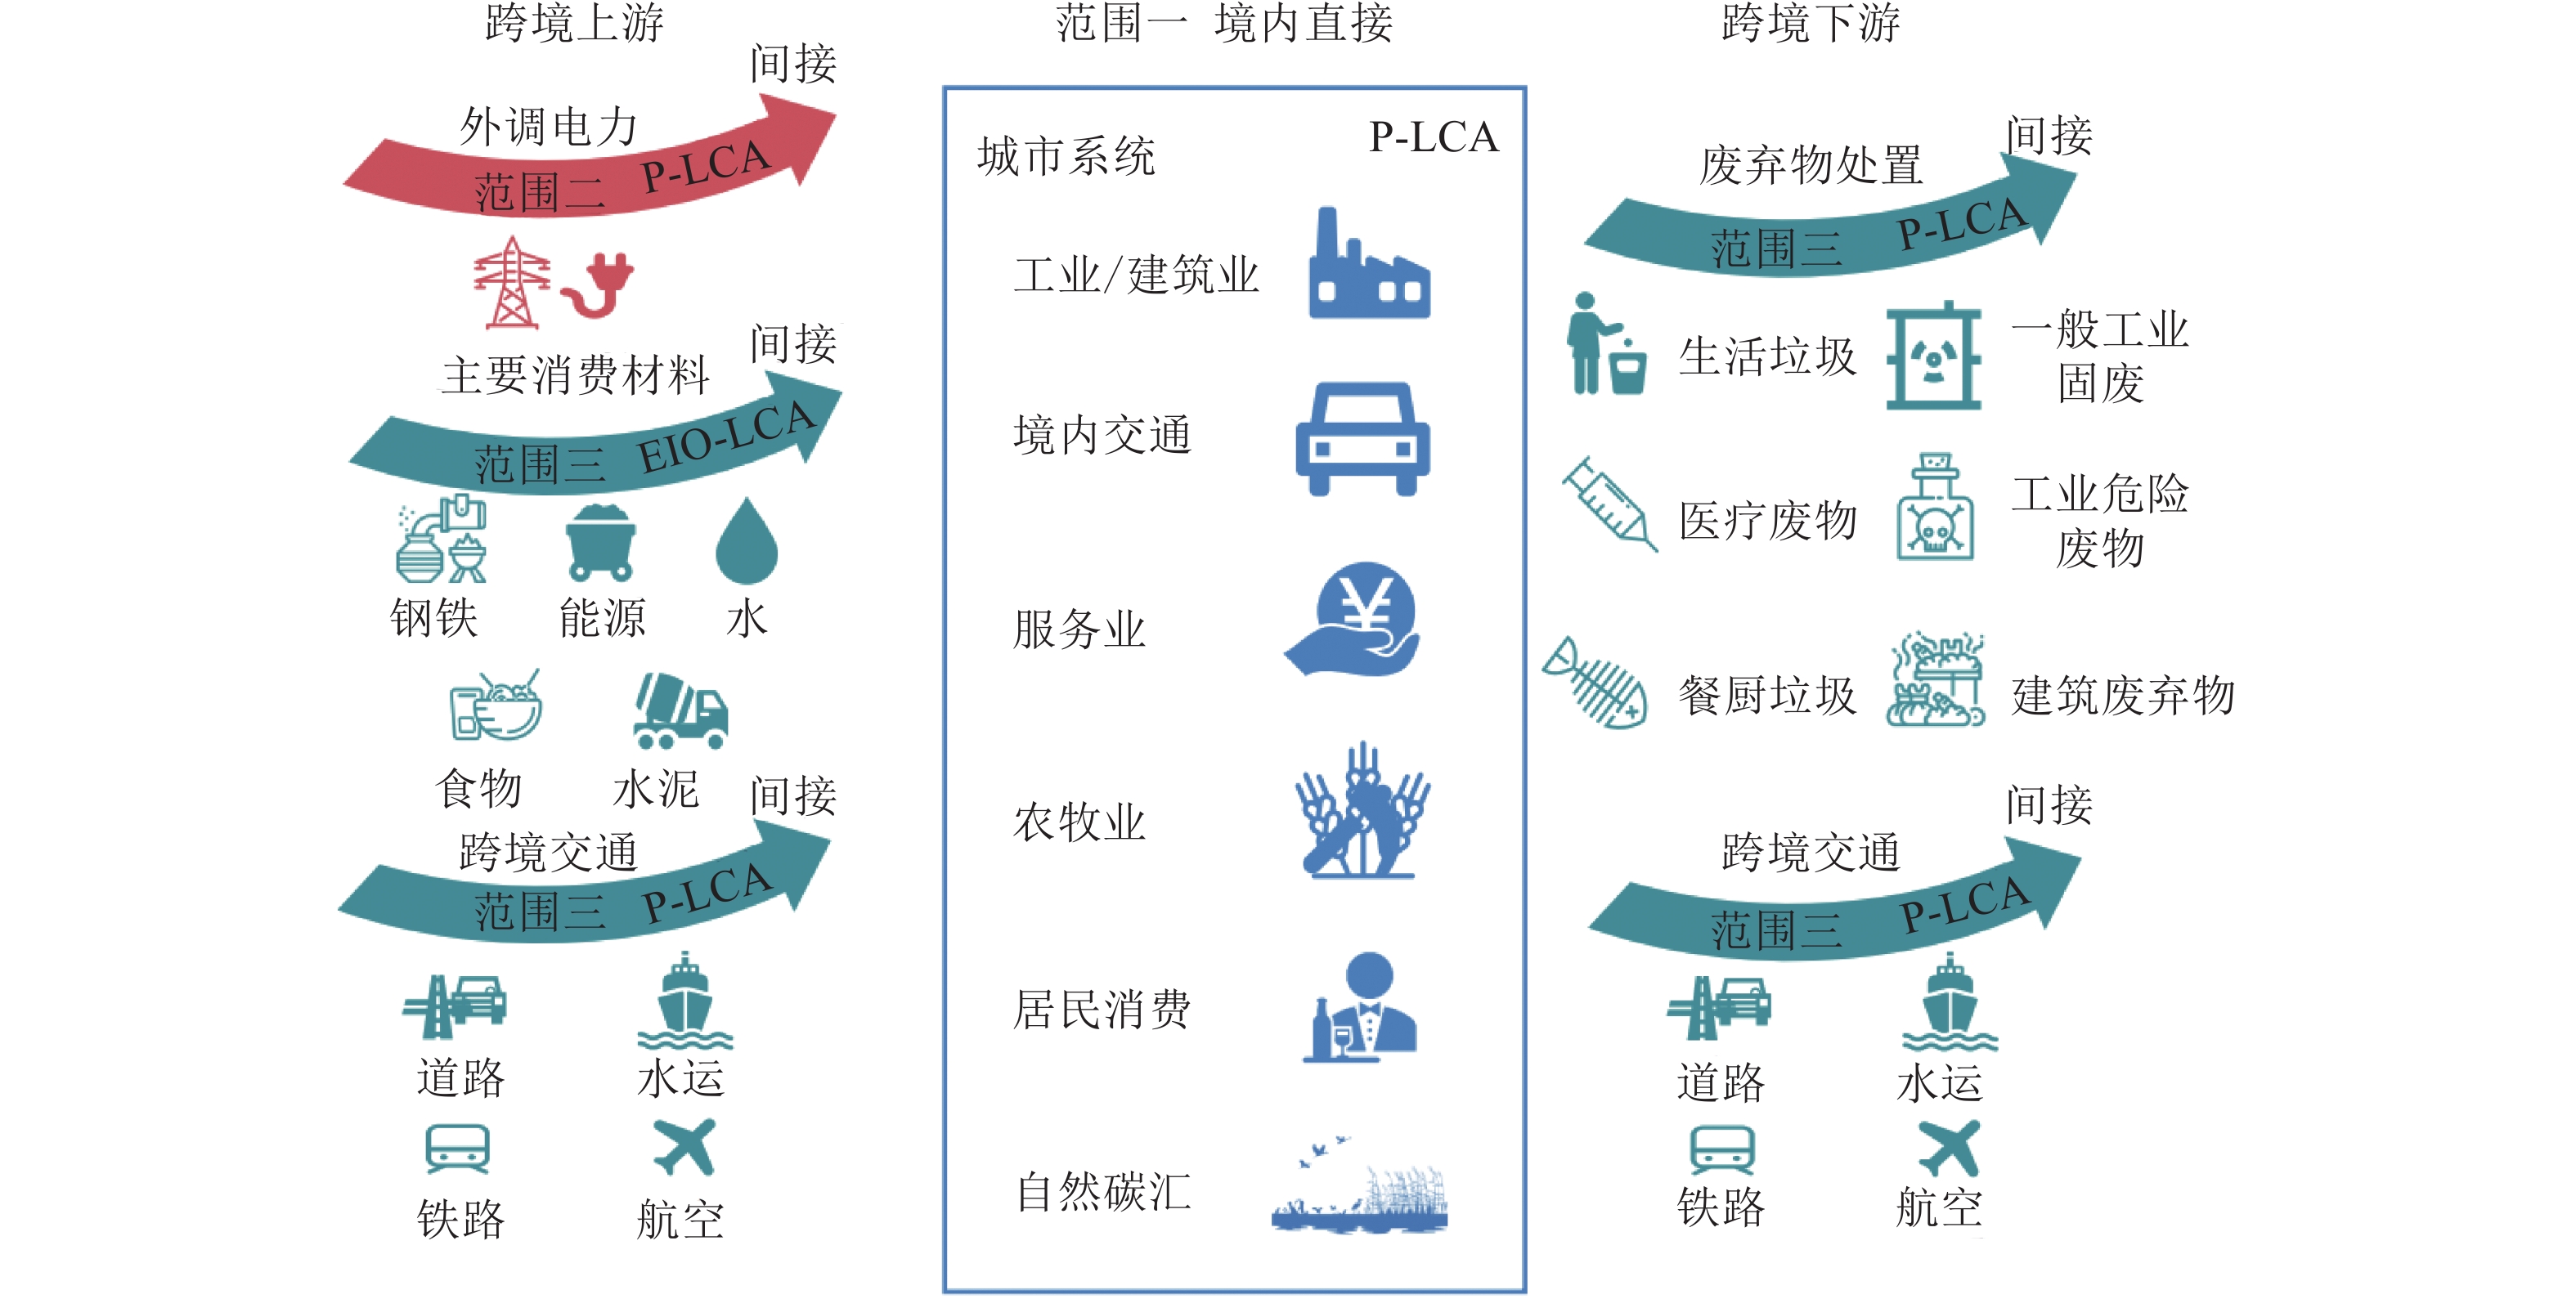
摘要:基于生命周期视角构建了城市碳足迹核算框架及方法学模型,系统地核算及追溯了碳排放在开放的城市“自然-经济-社会复合生态系统”中的足迹,主要涵盖城市地域边界内的直接生产碳排放以及跨境间接碳排放(主要包括城市所需的关键支撑物质、排放的主要废弃物,以及跨境交通分别在上游、下游产生的间接碳排放),并选取深圳市作为案例进行分析.结果表明,2015年深圳市碳足迹总量为6566.19万t CO 2e,具体为:1)城市内主要产业部门及居民消费的能源活动及非能源活动引起的直接碳排放量(Scope 1)为3282.38万t CO 2e,占深圳市碳足迹总量的49.99%,其中工业能源部门占比最大,为36.95%;2)城市外调电力消费引起的间接碳排放(Scope 2)占城市碳足迹总量的18.89%;3)跨境运输、关键支撑物质的上游产业链以及废弃物在下游处理过程中隐含的间接碳排放(Scope 3)占城市碳足迹总量的31.12%,其中5.37%来自跨境交通,22.26%来自主要物质上游供应链,3.49%来自下游废弃物处理.由此可知,2015年深圳市在城市上下游跨边界的间接碳排放量与城市内部的直接排放量相当,不容忽视.研究结果可为厘清城市自身碳排放现状及应对碳中和战略提供政策建议及管理启示.Abstract:Cities take up only 3% of the Earth’s land surface but consume 67%-76% of global energy, emit 75% of total carbon.As a vital battleground to control carbon emission, cities have undertaken a leading role in carbon neutrality strategy.Cities consume lots of final products and services derived from outside the city during urban expansion and development.In the open urban economic system, spatial mismatch between production and consumption of final products and services results in carbon emissions embodied in the trade flowing into producing regions.However, current urban carbon governance policies are primarily formulated from a traditional production-based perspective, ignoring transboundary carbon emissions driven by final demand in the cities.The resulting carbon leakages can easily cause unequal distribution of urban and regional carbon emission reduction responsibilities.Building a systematic urban carbon accounting method is urgently needed for national carbon neutral strategy.Therefore, we constructed urban carbon footprint accounting framework and methodology from a life cycle perspective.This system was used to account for and track carbon footprint in open urban “natural-economic-social complex ecosystem”, taking into account of both direct geographical carbon emissions and indirect transboundary carbon emissions.We selected Shenzhen in a case study.Data show total carbon footprints of 6545.01×10 4tons of CO 2ein Shenzhen in 2015.The direct carbon emissions (Scope 1) caused by energy and non-energy activities by main industrial sectors and residential consumption were 3282.38×10 4tons of CO 2e, accounting for 50% of total carbon footprint, of which industrial energy sector accounted for 29.2% of the total.Indirect carbon emissions (Scope 2) caused by purchased electricity consumption accounted for 19% of the total footprint.Indirect carbon emissions (Scope 3) embodied in transboundary transportation (5.27%), upstream supply chain of critical materials (22.01%) and downstream chain of waste disposal (3.72%) accounted for 31%.These data indicate that Shenzhen's indirect carbon emissions in 2015 were comparable to direct emissions.These results will provide policy suggestions and management implications for cities to clarify their carbon emission status and respond to carbon neutralization strategy.
-
Key words:
- carbon neutrality/
- carbon footprint/
- cities/
- life cycle perspective
-
表 13种城市碳核算视角及其应用举例
核算视角 核算边界 核算方法 代表性研究 基于地域或生产 城市地理行政边界内所有能源及非能源活动直接产生的碳排放(Scope 1) 过程分析法/
清单法Cai等[3];孟凡鑫等[4];
Shan等[5]基于地域和供应链 除地域排放外,还包括以外调电力及热量、主要消费材料等为代表的活动在上游供应链引发的间接排放(Scope 1+2+3) 混合分析法(过程分析+
投入产出分析)林剑艺等[6]; 陈绍晴等[7];
Ramaswami等[8]基于消费 由城市边界内最终消费活动(政府消费、居民消费、库存增加、资本形成等)驱动的在全球价值链中产生的所有直接碳排放和间接碳排放(Scope1(不包含国内调出及出口)+所有Scope 3) 投入产出分析 Mi等[9];Meng等[10];
Chen等[11] 下载:
导出CSV
下载:
导出CSV
表 2深圳市2015年碳足迹清单
碳排放范围 分类 部门 部门碳排放/
万t(比例/%)分类碳排放/
万t(比例/%)范围碳排放/
万t(比例/%)范围一 能源活动 服务业 222.18 (3.38) 3046.54 (46.40) 3282.38 (49.99) 农村生活 0.69 (0.01) 城镇生活 68.68 (1.05) 农业 1.43 (0.02) 工业能源 2426.10 (36.95) 工业过程 0 (0) 境内交通 327.46 (4.99) 非化石能源活动 CH4活动 168.06 (2.55) 235.84 (3.59) N2O活动 1.74 (0.03) 含氟气体活动 66.04 (1.01) 范围二 外调电力 外调电力 1240.54 (18.89) 1240.54 (18.89) 1240.54 (18.89) 范围三 跨境交通 道路 192.89 (2.94) 352.45 (5.37) 2043.27 (31.12) 水运 43.75 (0.67) 铁路 10.65(0.16) 航空 105.16 (1.60) 关键支撑物质上游产业链 食物 139.17 (2.12) 1461.56 (22.26) 钢铁 154.12 (2.35) 水泥 666.90 (10.16) 能源 379.22 (5.77) 水 122.15 (1.86) 废弃物的下游处理 生活垃圾 204.90 (3.12) 229.26 (3.49) 一般工业固废 19.52 (0.30) 工业危险废物 1.92 (0.03) 医疗废物 0.05 (0) 餐厨垃圾 2.04 (0.03) 建筑废弃物 0.83 (0.01) 城市碳足迹合计 6566.19 6566.19 6566.19 注:“()”中的数值表示相应碳排放量在城市碳足迹合计中的比例. 下载:
导出CSV
-
[1] United Nations, Department of Economic and Social Affairs, Population Division. World urbanization prospects: the 2018 revision[R]. New York: United Nations, 2019 [2] SETO K C,CHURKINA G,HSU A,et al. From low- to net-zero carbon cities:the next global agenda[J]. Annual Review of Environment and Resources,2021,46:377doi:10.1146/annurev-environ-050120-113117 [3] CAI B F,LU J,WANG J N,et al. A benchmark city-level carbon dioxide emission inventory for China in 2005[J]. Applied Energy,2019,233/234:659doi:10.1016/j.apenergy.2018.10.016 [4] 孟凡鑫,李芬,刘晓曼,等. 中国“一带一路”节点城市CO2排放特征分析[J]. 中国人口·资源与环境,2019,29(1):32 [5] SHAN Y L,GUAN D B,ZHENG H R,et al. China CO2emission accounts 1997-2015[J]. Scientific Data,2018,5:170201doi:10.1038/sdata.2017.201 [6] 林剑艺,孟凡鑫,崔胜辉,等. 城市能源利用碳足迹分析:以厦门市为例[J]. 生态学报,2012,32(12):3782 [7] 陈绍晴,龙慧慧,陈彬. 代谢视角下的城市低碳表现评估[J]. 中国科学:地球科学,2021,51(10):1693 [8] RAMASWAMI A,HILLMAN T,JANSON B,et al. A demand-centered,hybrid life-cycle methodology for city-scale greenhouse gas inventories[J]. Environmental Science & Technology,2008,42(17):6455 [9] MI Z F,ZHANG Y K,GUAN D B,et al. Consumption-based emission accounting for Chinese cities[J]. Applied Energy,2016,184:1073doi:10.1016/j.apenergy.2016.06.094 [10] MENG F X,LIU G Y,HU Y C,et al. Urban carbon flow and structure analysis in a multi-scales economy[J]. Energy Policy,2018,121:553doi:10.1016/j.enpol.2018.06.044 [11] CHEN S Q,LONG H H,CHEN B,et al. Urban carbon footprints across scale:important considerations for choosing system boundaries[J]. Applied Energy,2020,259:114201doi:10.1016/j.apenergy.2019.114201 [12] 中国城市温室气体工作组. 中国城市温室气体排放数据集: 2015[M]. 北京: 中国环境出版集团, 2019 [13] 蔡博峰,刘晓曼,陆军,等. 2005年中国城市CO2排放数据集[J]. 中国人口·资源与环境,2018,28(4):1 [14] 中国城市温室气体工作组(CCG). 中国产品全生命周期温室气体排放系数库[EB/OL]. 2022[2021-10-17]. http://lca.cityghg.com/ [15] 关大博教授团队. 中国碳排放数据库(CEADs)[EB/OL]. [2022-10-17].https://www.ceads.net.cn/ [16] CHEN S Q,LONG H H,FATH B D,et al. Global urban carbon networks:linking inventory to modeling[J]. Environmental Science & Technology,2020,54(9):5790 [17] DANA B,ANU R. What is the contribution of city-scale actions to the overall food system’s environmental impacts?:assessing water,greenhouse gas,and land impacts of future urban food scenarios[J]. Environmental Science & Technology,2017,51(20):12035 [18] MENG F X,LIU G Y,YANG Z F,et al. Structural analysis of embodied greenhouse gas emissions from key urban materials:a case study of Xiamen city,China[J]. Journal of Cleaner Production,2017,163:212doi:10.1016/j.jclepro.2016.11.108 [19] 丛建辉,刘学敏,赵雪如. 城市碳排放核算的边界界定及其测度方法[J]. 中国人口·资源与环境,2014,24(4):19doi:10.3969/j.issn.1002-2104.2014.04.004 [20] 蔡博峰, 张建军, 董会娟. 中国城市温室气体排放: 2015年[M]. 北京: 中国环境出版集团, 2019 [21] CAI B F,YANG W S,CAO D,et al. Estimates of China’s national and regional transport sector CO2emissions in 2007[J]. Energy Policy,2012,41:474doi:10.1016/j.enpol.2011.11.008 [22] LIN J Y,LIU Y,MENG F X,et al. Using hybrid method to evaluate carbon footprint of Xiamen city,China[J]. Energy Policy,2013,58:220doi:10.1016/j.enpol.2013.03.007 [23] 张宇,段华波,张宁. 深圳市建筑水泥流量-存量分析及环境影响评估[J]. 中国环境科学,2021,41(1):482doi:10.3969/j.issn.1000-6923.2021.01.054 [24] 李蕾. 餐厨垃圾收运与集中处置一体化体系构建研究: 以深圳市为实证分析[C]//中国城市规划学会, 沈阳市人民政府. 规划60年: 成就与挑战: 2016中国城市规划年会论文集(02城市工程规划). 沈阳: 中国城市规划学会, 2016: 11 [25] 李蕾,唐圣钧. 深圳:综合利用建筑废弃物实现“资源再生”[J]. 建筑,2018(10):24doi:10.3969/j.issn.0577-7429.2018.10.010 [26] 碳阻迹(北京)科技有限公司. Carbonstop碳排放因子数据库[EB/OL]. [2022-10-17]. https://www.carbonstop.net/freeTry?pageFlag=product-data [27] 张丽峰,潘家华. 中国区域碳达峰预测与“双碳”目标实现策略研究[J]. 中国能源,2021,43(7):54doi:10.3969/j.issn.1003-2355.2021.07.008 [28] 庄贵阳,魏鸣昕. 城市引领碳达峰、碳中和的理论和路径[J]. 中国人口·资源与环境,2021,31(9):114 -

 下载:
下载:

 点击查看大图
图(1)/
表(2)
计量
- 文章访问数:98
- HTML全文浏览量:18
- PDF下载量:19
- 被引次数:0
